Making Copies
What to Do: Replicate Using ggplot
In this task, you are asked to do three things:
Pick one of the Plots given in the tabs.
Replicate a static version of it using
ggplot2Produce one alternative visualization using the same dataset in
ggplot2
Visualization Choices
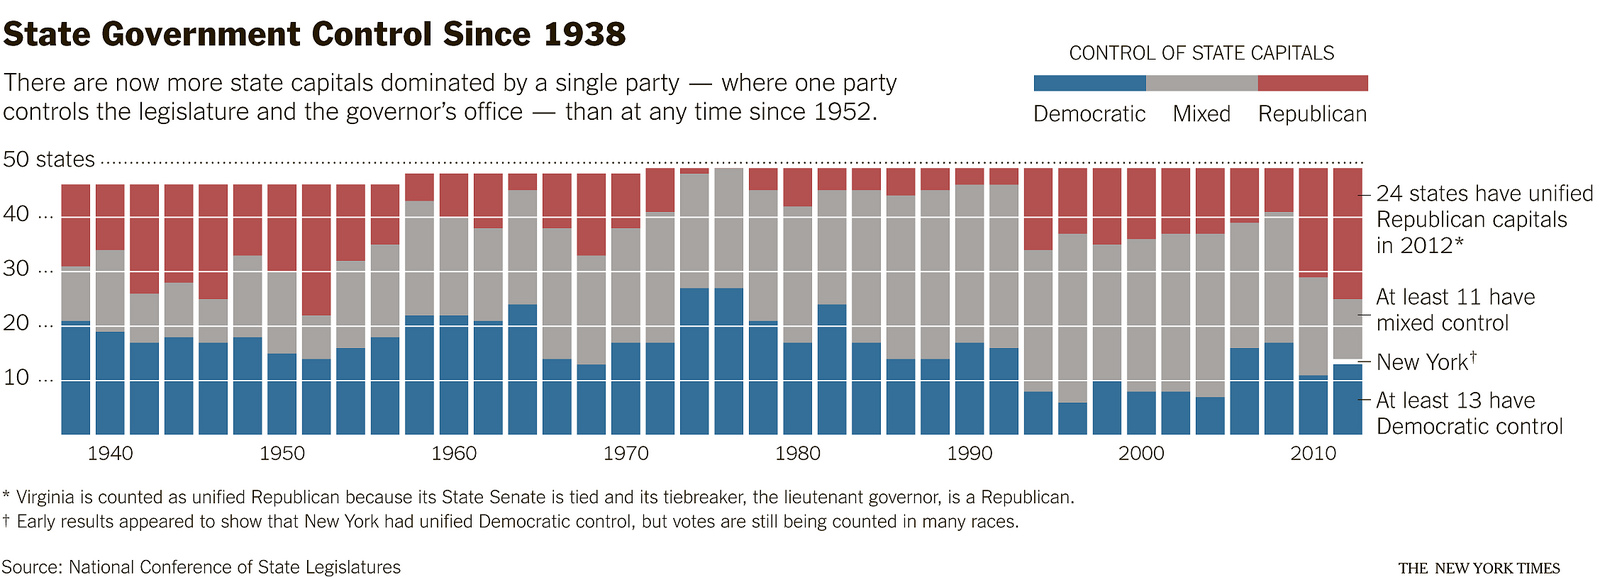
Choice 1: Government Data
This graphic was published in the New York Times back in 2012. You are tasked to replicate and construct an alternative for it.

Download the visual
Download the data set divided.csv to construct this visualization.
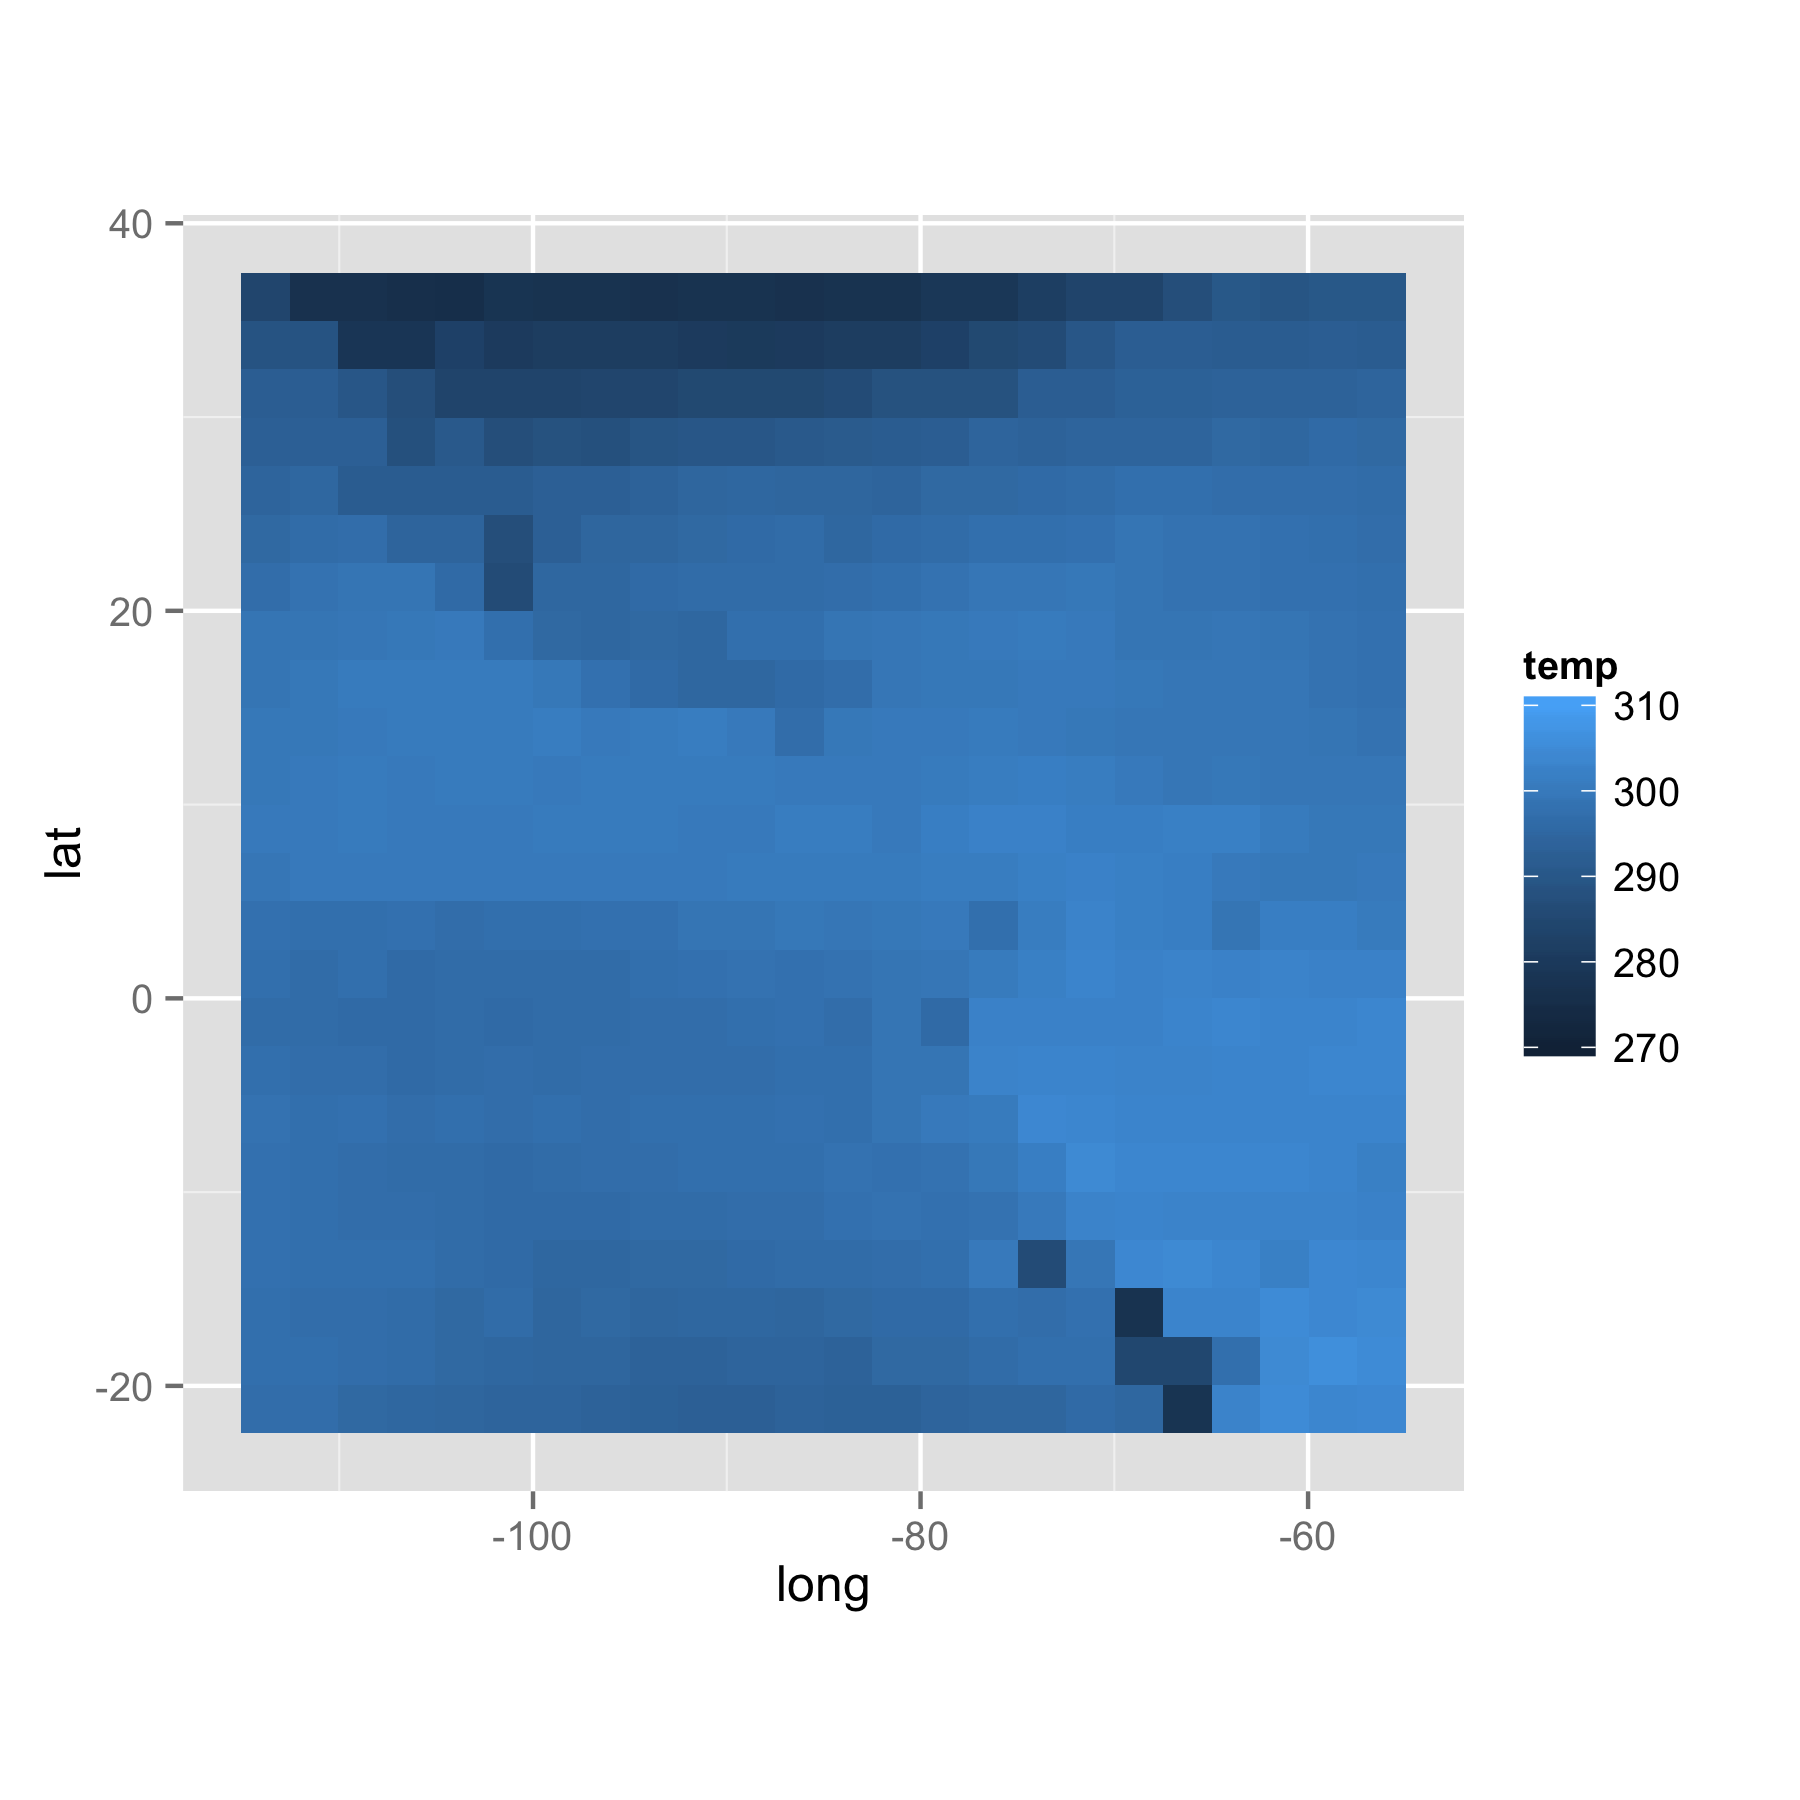
Choice 2: Surface Temperatures
You are looking at the surface temperature Dec 2001 on a very coarse 24 by 24 grid covering Central America. You are tasked to replicate and construct an alternative for it (Hint: use geom_tile())

To get the data, run the following in your script and Rmarkdown document:
install.packages("nasaweather")

library(nasaweather)

jan2001 <- subset(atmos, year == 2000 & month == 1)
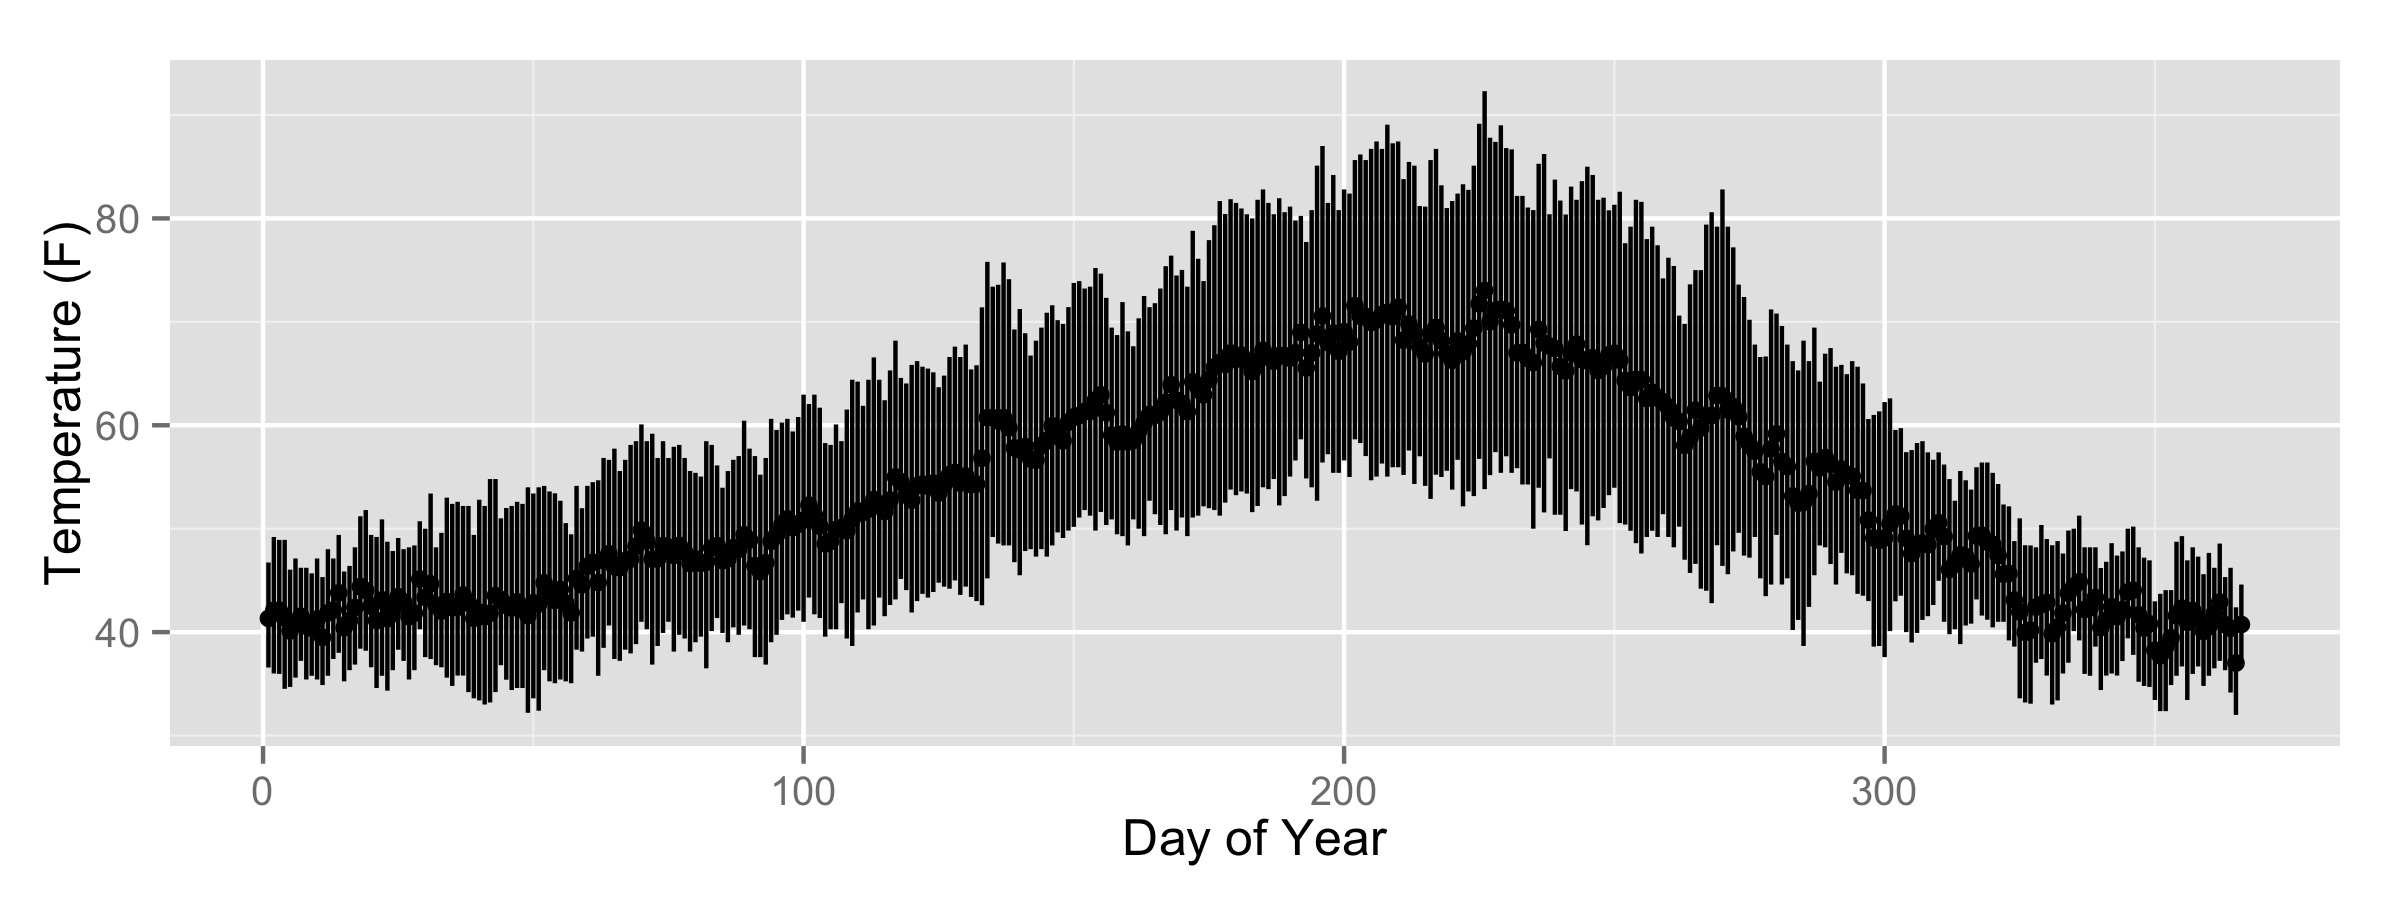
Choice 3: Average Temperatures
This data set for the following plot includes the average mean, minimum, and maximum daily temperature in Corvallis, Oregon based on a ten year span. You are tasked to replicate and construct an alternative for it: (Hint: use geom_pointrange())

Download the visual
Download the data set corv.csv to construct this visualization.
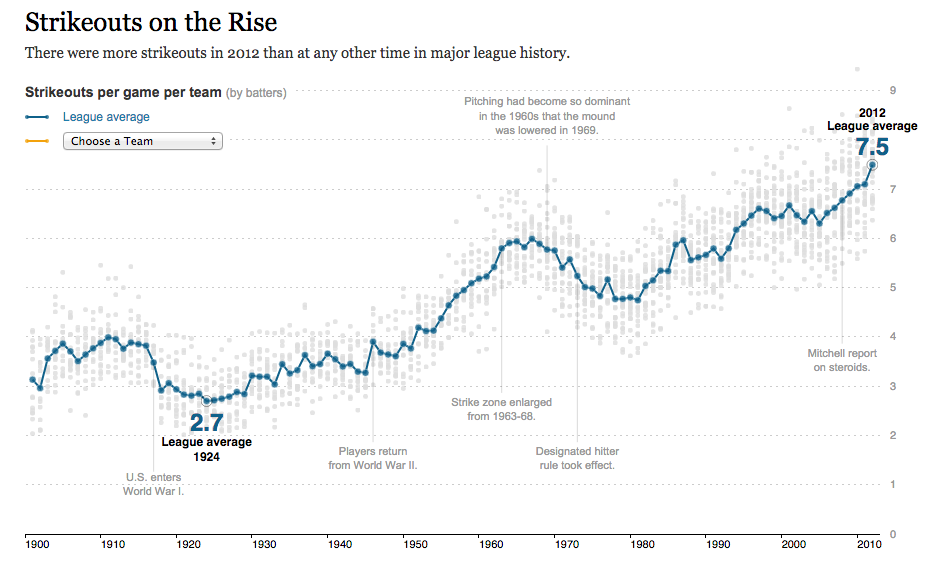
Choice 4: Baseball
This graphic was published in the New York Times back in 2013. You are tasked to replicate and construct an alternative for it.

To get the data, run the following in your script and Rmarkdown document:
install.packages(Lahman)
library(Lahman)
library(dplyr)

# Pipes everwhere!
so_by_team <- select(Teams, yearID, name, G, SO) %>%
               mutate(strikeouts_per_game = SO/G)

avg_so_by_year  <- so_by_team %>%
                    group_by(yearID) %>%
                    summarise(avg_so = mean(strikeouts_per_game))

# you can either use both so_by_team & avg_so_by_year,
# or use only so_by_team and look at ?stat_summary
How to Do It:
Open the
Relications_Practice_Script.Rblank R script or simple create one as you normally would. Then get to replicating one of the visualizations given above using the corresponding data set.After you are happy with your plots, double click and open the file
Replications.rmd. It should load up into RStudio.Follow the directions and copy the appropriate parts over. Make sure to compile the document!
Submit the PDF output of the Rmarkdown to #wk-5-replications
You can download all of the scripts to fetch data, Relications_Practice_Script.R and Replications.rmd by clicking below
More about Rmarkdown
Its not a bad idea to see what you can do with an Rmarkdown document. For example, you can actually output a file in nearly any format (e.g. Pages, PDF, HTML, Word, etc.) In fact this course website is written on an Rmarkdown platform called Blogdown.
Here are some resources that may be helpful at the current time: